Exploring Claim Lifecycles

Post author: Martin Saunders, Head of Service
I hope that everyone has had opportunity to review and reflect upon the routine data release we shared last week. We are always looking at ways in which we can enhance the data that we share, and one of the areas not currently commented on in our reporting, is lifecycle. It’s an area that has occupied quite a few column inches in the industry press since we launched. So, I thought I’d try and help to expand understanding by sharing some additional operational insight to underpin where the market is up to and where it’s possibly heading.
What is a claim lifecycle?
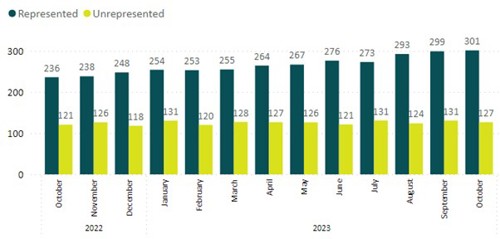
Lifecycle in OIC terms is measured in days between when a claim enters our system (a new claim is made) and when we are told it’s settled (the system is told of the agreement – payment happens outside the service and will take a few more days). There is a marked difference between the performance of those that are represented and those that are not. Outcomes measured in financial settlements remain broadly the same, with unrepresented claimants still seeing marginally better results than represented claimants. Graph 1 below shows how the average lifecycle has developed over the last 12 months and pulls out the differentiation between representation types.
Graph 1:
What’s the difference?
So, the question is, why is it taking so long for claimants who are represented to complete the journey, when those that undertake it themselves settle in less than half the time? The process is essentially the same: have an accident, make the claim, sort liability, have a medical, share the report and add any losses. So why the difference? Looking at this as the service provider we know that a large number of cases are sat beyond a point when liability has been accepted, but before a medical has been shared. We call this stage ‘pend medical’ in the system, although it incorporates a number of mini stages, including select/instruct an expert, be examined, the lawyer getting instructions, and generally getting the case ready to present, to name but a few.
We have analysed the system data to see what this cohort of cases in ‘pend medical’ looked like a year ago in order to gain some perspective of progress, the results are depicted in graph 2 below.
Graph 2:

KEY: gold = settled, brown = pend medical, lime = left service, teal = still under negotiation.
Graph 2 shows us that 129,000 cases were in this ‘pend medical’ status a year ago. What it also shows us is that they don’t stand still: 41,000 cases have gone on to settle, 25,000 are currently being negotiated and 49,000 cases are still in that ‘pend medical’ status. To complete the picture, 14,000 of those original cases have left the service completely.
If we were to wind the clock forward and refresh the data again today, we would see 140,000 cases in the system and in this ‘pend medical’ status. We always knew it was an area that would hold a large number of cases, it has to as this is the place where the claim is assembled, ready for presentation.
Is this useful?
This level of data has not been previously shared, if you find it of interest and would like to see more, please let us know. We are currently working on some dormancy data to further enrich insight. That update will follow in the coming weeks.
Discover more
Stay up to date and read our latest news from Official Injury Claim.